N-WATCH
N-WATCH is a world-first system designed to monitor the leaching of nutrients (Nitrate and Potassium) in soil 24/7.
As you will no doubt be aware, nitrate leaching is harmful to the environment because it can contaminate groundwater and surface water sources. High levels of nitrates in water bodies can lead to eutrophication, which causes excessive algae growth, depletes oxygen levels, and harms aquatic life.
We have built the system to monitor leaching in the soil zone below the roots of whatever crop may be growing at the site of the N-WATCH monitoring point, however, how you choose to use it is entirely up to you.
The system is comprised of a
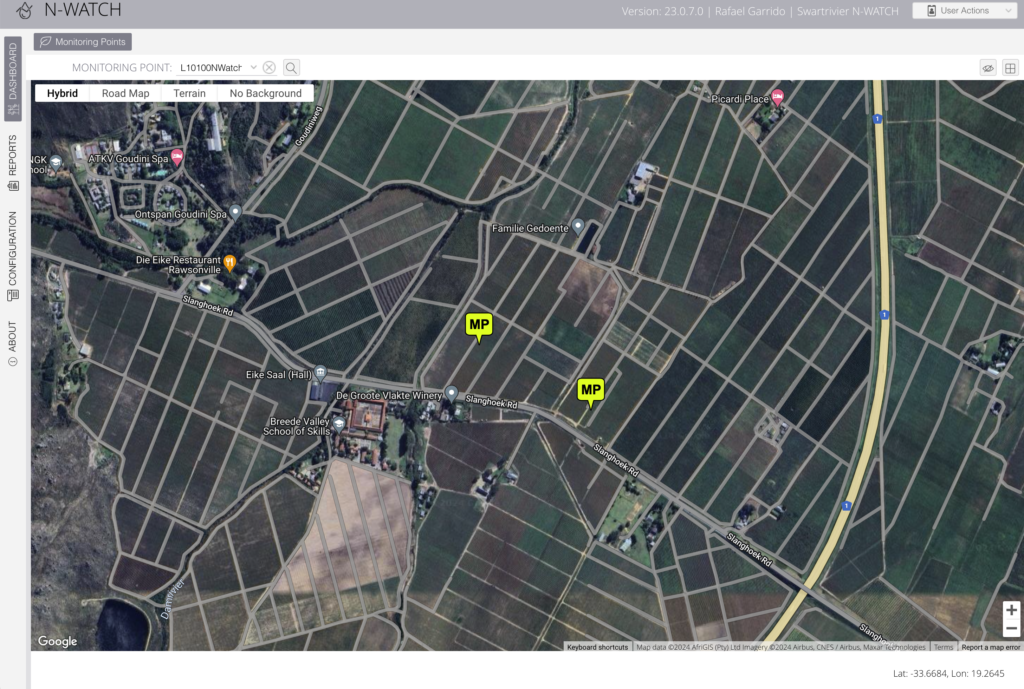
Below is a map in the N-WATCH web application showing 2 N-WATCH monitoring points on a vineyard in South Africa’s Cape Region.
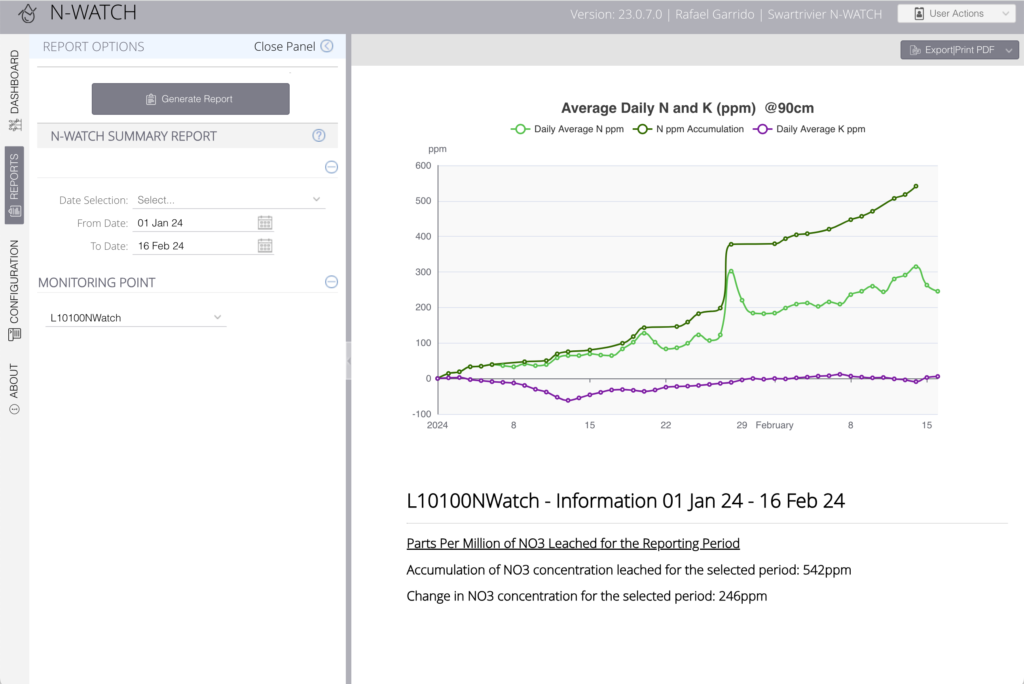
Below is a screenshot of the report generated by the N-WATCH web application. This report can be exported to a PDF file for emailing or printing.
The report show the Daily Average Nitrate and Potassium concentration for the selected period (in this case “Year to Date”).
The chart on the report also shows the Accumulation of Nitrate over the period of the report. In other words, the total amount of Nitrate leached out of the root zone of the vines over the period. The Nutrisens probe at this monitoring point is at a depth of 90cm.
The chart can be also be seen on the N-WATCH Dashboard where any date/time span can be selected. The chart will always start out with the N & K graph lines at zero so the change in N an K concentration over the selected period can be calculated.
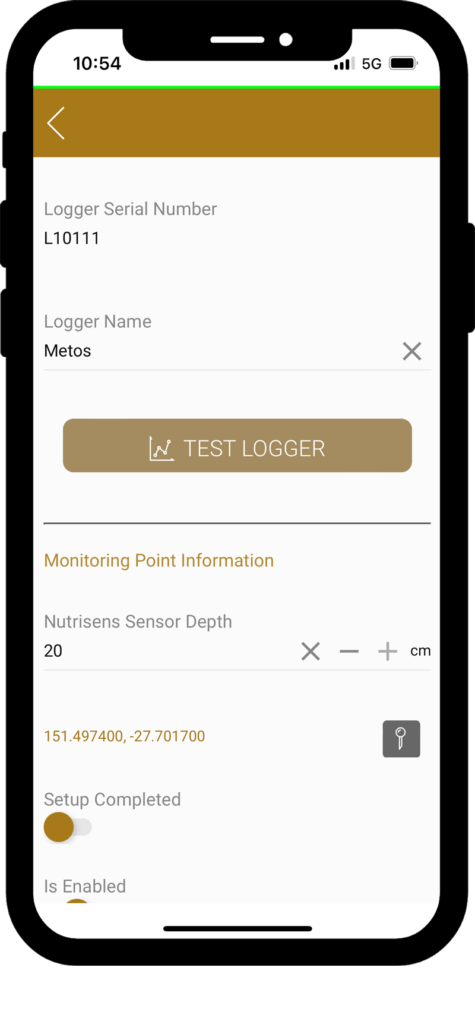
Left is a screenshot of the main screen of the N-WATCH installer app.
By design, the app is very simple and easy to use and comes with a user manual.
PLEASE CONTACT US FOR MORE INFORMATION

This website uses cookies to improve your experience. We will assume you are ok with this, but you can opt-out if you wish. Read More
| Name | Domain | Purpose | Expiry | Type |
|---|---|---|---|---|
| wpl_user_preference | www.agcommander.com | GDPR Cookie Consent Preferences | 1 year | HTTP |
| YSC | youtube.com | YouTube session cookie. | 52 years | HTTP |
| Name | Domain | Purpose | Expiry | Type |
|---|---|---|---|---|
| _gat_gtag_UA_178432246_1 | agcommander.com | Google Ads Tracking | Session | --- |
| VISITOR_INFO1_LIVE | youtube.com | YouTube cookie. | 6 months | HTTP |
| Name | Domain | Purpose | Expiry | Type |
|---|---|---|---|---|
| _ga | agcommander.com | Google Universal Analytics long-time unique user tracking identifier. | 2 years | HTTP |
| _gid | agcommander.com | Google Universal Analytics short-time unique user tracking identifier. | 1 days | HTTP |